Inter-comparisons
home
WCC-SF6
Inter-comparisons
 SICE (SF6 Inter-comparison Experiment)
-
To ensure a link between the measurement scales of the stations and CCL, WCC-SF6 organized SF6 inter-comparison experiment (SICE) across the 12 laboratories of 8 countries in 2016-2017.
 Circuit 1. European Region (9 labs)
-
European Region 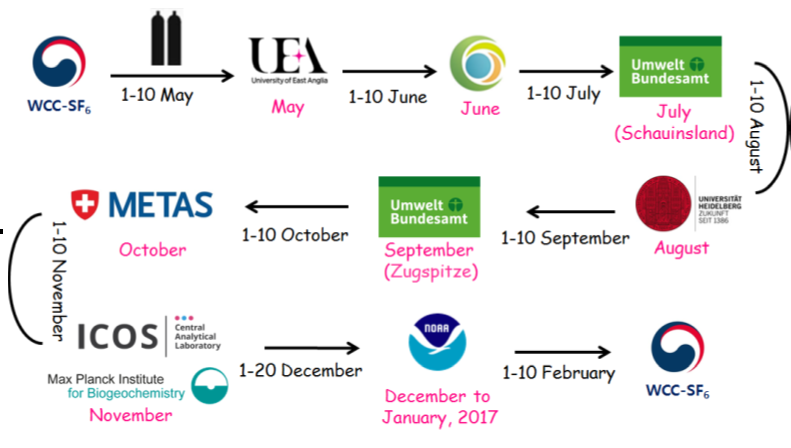
Figure 5. Participants and experiment schedule of 1st circuit
- Table 1. The results of inte-comparison experiment of 1st circuit
-
The results of inte-comparison experiment of 1st circuit Order Laboratory Result
(pmol/mol)Repeatability
(%)Lab-Wcc diff
(pmol/mol)Scale Low High Low High Low High 1 WCC-SF6 7.89 9.21 0.23 0.22 WMO-X2014 2 UEA 7.85
(7.86)9.16
(9.17)0.51
(0.51)0.45
(0.44)-0.04
(-0.03)-0.05
(-0.04)WMO-X2006
(WMO-X2014)3 LSCE 7.88 9.19 0.88 0.65 -0.01 -0.02 WMO-X2014 4 Schauinsland 7.96 9.20 0.03 0.03 0.07 -0.01 WMO-X2006 5 Heidelberg 8.02 9.42 0.26 0.36 0.13 0.21 Heidelberg scale 6 Zugspitze 8.00 9.24 1.00 0.80 0.11 0.03 WMO-X2014 7 METAS 7.95 9.30 0.46 0.22 0.06 0.09 METAS-2016 8 ICOS 7.92 9.18 0.23 0.27 0.03 -0.03 WMO-X2014 9 MPI-BGC 7.89 9.21 0.48 0.42 0.00 0.00 WMO-X2014 10 NOAA 7.89 9.21 0.12 0.12 0.00 0.00 WMO-X2014
-
Circuit 2. Asia-pacific Region (4 labs)
-
Asia-pacific Region 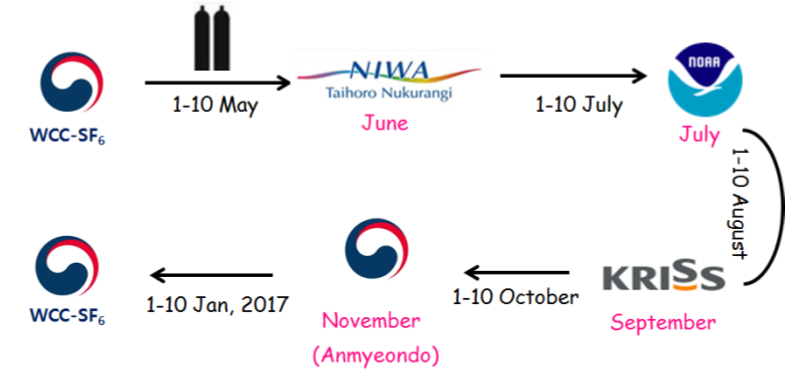
Figure 6. Participants and experiment schedule of 2nd circuit
- Table 2. The results of inte-comparison experiment of 2nd circuit
-
The results of inte-comparison experiment of 2nd circuit Order Laboratory Result
(pmol/mol)Repeatability
(%)Lab-Wcc diff
(pmol/mol)Scale Low High Low High Low High 1 WCC-SF6 7.88 9.20 0.11 0.18 WMO-X2014 2 NIWA 7.88 9.12 1.13 0.47 0.00 -0.08 WMO-X2014 3 NOAA 7.89 9.21 0.16 0.15 0.01 0.01 WMO-X2014 8 KRISS 7.91 9.16 0.25 0.22 0.03 -0.04 WMO-X2014
KRISS primary9 AMY 7.87 9.20 0.62 0.59 -0.01 0.00 WMO-X2014